 will stedden
Procrastinating with a Time Optimization Game
I've got to admit, I'm majorly busy at this time of year. But today, I'm deciding to procrastinate by writing a post on—ironically enough—a game about optimizing your use of time!

The Background
If you've ever participated in an economics research study, you've probably had the pleasure of participating in a "computerized experiment." These are pretty much just silly games that you play for a little while so the researchers can "measure" your behavior.
Recently, I played a game that asked me to choose between two tasks in order to maximize the payoff (I'll give more details below). I did pretty well at making a gut decision on which one to choose during the game, but I knew that there had to be some way to figure out the optimum choice. So afterwards, I decided to analyze the game a little more and find out how to explain it mathematically.
The Game Premise
Imagine you spend your work dividing your time between two tasks. One of them is an easy task that takes 1 minute, and the other is a hard task that takes 2 minutes.
For the easy task, you're always offered $1, while for the hard task you get offered a different amount between $1 and $5.
Unfortunately, whether you pick the easy task or the hard one, you aren't guaranteed to get paid every time. You're told the probability that you'll get paid before you decide which task to take. For simplicity we'll just say the chances of getting paid are 33%, 66%, or 100%.
So the challenge is to decide whether you want to waste your time on the hard task given the offered payout and the probability of getting payed.
Sample Game
To make the game more clear, I built a sample game in javascript on CodePen. The objective is to make the most money you can before you use up all your time.

Before we look at the answer you should give the game a shot. Try it out.
Trying to find a general solution
After playing around for a few minutes you'll probably get the idea of how best to win. It makes sense to only take the hard task when you have a chance of getting more than $2. The real trick though is that sometimes, even though you might make more, the odds that you'll win are so low that you shouldn't waste your time on the hard task.
My original rule of thumb was to take the hard task only when the expected value of the hard task (i.e. offered payout * chance of winning) was higher than $2. My logic was just that I should only waste my time when I have a reasonable chance of getting the higher payout.
But I was pretty sure there must be a more solid way to figure out what the cutoff offer should be. And I wasn't going to rest until I found it.
Simulate it!
I needed to get a better understanding of what would happen given a cutoff dollar value above which I'd take the hard task. Of course, I didn't want to have to play the game over and over again just to find out the outcome. Instead, I wrote a simulation of the game in MATLAB.
I've got the functional simulation code on GitHub. It looks complicated, but it's basically just a loop that picks one probability (33%, 66%, or 100%) and then picks the corresponding "choice" threshold. Then it just simulates the game by offering a random value and letting the "choice" decide whether the offer is accepted. It adds up winnings and time according to the choice and the outcome.
winnings = 0;
i = 1;
t = 0;
while (t<totaltime)
  index = unidrnd(length(probabilities));
  p = probabilities(index);
  c = choices(index);
  offer = unifrnd(minval, maxval);
  if(unifrnd(0, 1)<p)
    if(offer>c)
      winnings = winnings+offer;
      t = t+hardT;
    else
      winnings = winnings+minval;
      t = t+easyT;
    end
  else
    if(offer>c)
      t = t+hardT;
    else
      t = t+easyT;
    end
  end
end
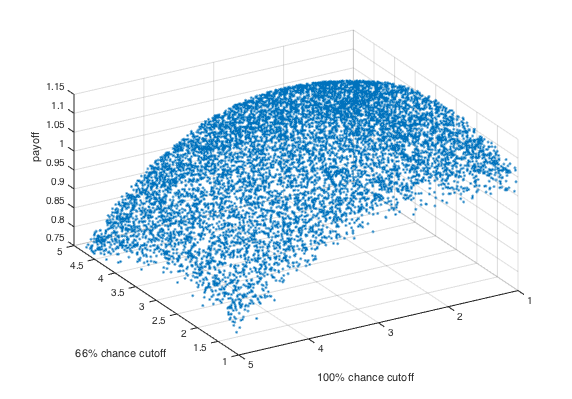
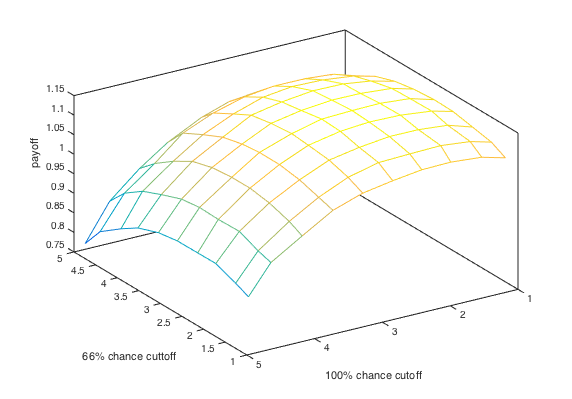
With this simulation I was able to graph the winnings as a function of each choice threshold. It's tough to visualize all three dimensions at once, but here I've plotted the winnings as a function of two of the choice thresholds.

You can kind of see that the maximum return takes place with these two thresholds set somewhere around $2 and $3. But still, there should be a way to describe this mathematically so that I can get a nice clean number to set as the threshold.
Deriving a solution
Using the intuition I got from the simulation, I wanted to work out a mathematical formula that would predict the average payout for a given set of choice thresholds.
The outcome is just the product of the number of rounds you play times the average winnings for each round. The average winnings is obviously a function of the choice thresholds because that's what determines whether you take the easy or hard task.
What makes it more interesting is that the number of rounds you play is also a function of your choice thresholds. The lower your choice threshold, the more hard tasks you'll try, meaning you'll get fewer rounds before the time runs up.
So I basically needed a formula that would take those two things into account. I can't go through all of my reasoning because it would be sooooo tedious, but I'll break it down in a few math steps.
To get started we know that the total winnings is just going to be the sum of the winnings from the easy rounds and the winnings from the hard rounds.
W_{tot} = f_e\frac{T}{t_e}w_e + f_h\frac{T}{t_h}w_h
We know the total time, T, and the time it takes for the hard and easy tasks, t_e, t_h. So we just need to figure out the fraction of the time spent on the hard and easy tasks (f_e,f_h) and the average amount you'd win for both (w_e,w_h).
I'm going to leave that part up as an exercise for the reader, but after a little head scratching I was able to figure it out. The solution looks like this
W_{tot} = \frac{T}{t_e}\left ( 1 - \frac{1}{1+\tfrac{O_{max}-O_{min}}{O_{max}-\bar c}\tfrac{t_e}{t_h-t_e}}\right )w_{avg}
For the new variables, O_{max}andO_{min} are the max and min offers, \bar c is the average value of your three choice thresholds, and w_{avg} is the average payoff for an individual turn.
w_{avg} = \sum p_i((O_{max}-c_i)(c_i+O_{max})/2 + O_{min}(c_i-O_{min}))/(O_{max}-O_{min})
This ended up being really ugly by the end. To ensure that I was calculating this solution correctly, I wrote another MATLAB function to print my predicted value just like above. To me, this is a great way to prove whether you carried out the math right. The similarity between my analytical solution and the simulated results makes me confident that I didn't make any mistakes along the way.
It isn't perfectly easy to see using a point cloud so I binned the data to make it more clear. From this graph, it's pretty clear that the cutoff thresholds are $2.25 for the 100% chance and $2.90 for the 66% chance.
We could do a little more math to write out the optimum solution, but most of the challenge is over at this point. I think I'm going to call it a night.
What did we learn
Looking at simplified decision-making games is a fun way to think about how we make choices in our everyday life. Every choice offers us some risk that we've wasted our time on an uncertain reward. Maybe this blog post was just such a waste of time. But you know what, I had fun. Can you really put a price on that?
By the way, if you're a social psychologist or an economist, please leave a comment. I would love to know what this game is called. There has to be some cool history behind it that I'd like to learn about.
As usual you can find all the code for this project on the make_loft GitHub account, and you can find the online game on my CodePen account.